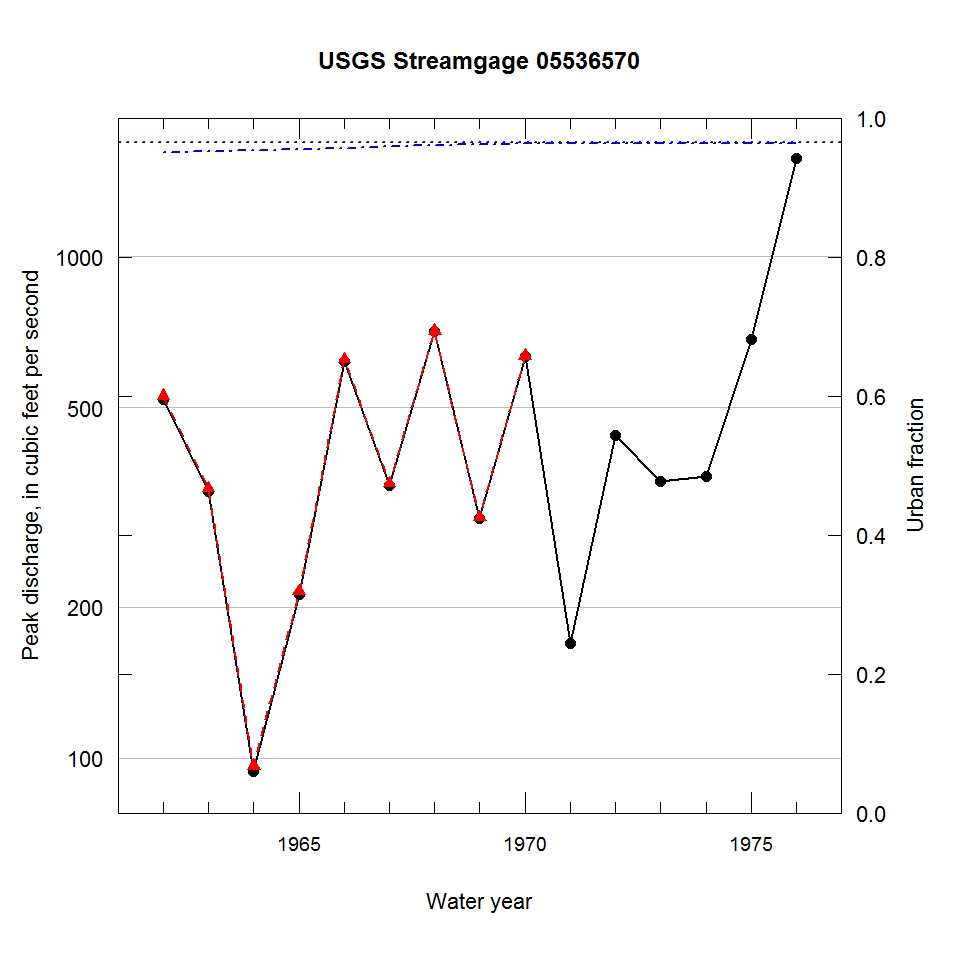
Observed and urbanization-adjusted annual maximum peak discharge and associated urban fraction and precipitation values at USGS streamgage:
05536570 STONY CREEK (WEST) AT WORTH, IL


| Water year | Segment | Discharge code | Cumulative reservoir storage (acre-feet) | Urban fraction | Precipitation (inches) | Observed peak discharge (ft3/s) | Adjusted peak discharge (ft3/s) | Exceedance probability |
| 1962 | 1 | 2 | 0 | 0.950 | 0.471 | 520 | 527 | 0.115 |
| 1963 | 1 | -- | 0 | 0.952 | 2.418 | 340 | 345 | 0.448 |
| 1964 | 1 | -- | 0 | 0.954 | 1.139 | 94 | 96 | 1.000 |
| 1965 | 1 | -- | 0 | 0.955 | 0.834 | 212 | 215 | 0.860 |
| 1966 | 1 | -- | 0 | 0.957 | 2.158 | 619 | 624 | 0.056 |
| 1967 | 1 | -- | 0 | 0.958 | 1.773 | 350 | 353 | 0.425 |
| 1968 | 1 | -- | 0 | 0.960 | 2.132 | 708 | 711 | 0.036 |
| 1969 | 1 | -- | 0 | 0.962 | 0.603 | 301 | 302 | 0.576 |
| 1970 | 1 | -- | 24 | 0.963 | 1.652 | 632 | 633 | 0.052 |
| 1971 | 0 | -- | 189 | 0.963 | 1.305 | 169 | -- | -- |
| 1972 | 0 | -- | 189 | 0.964 | 1.827 | 441 | -- | -- |
| 1973 | 0 | -- | 189 | 0.964 | 1.356 | 356 | -- | -- |
| 1974 | 0 | -- | 189 | 0.964 | 1.709 | 365 | -- | -- |
| 1975 | 0 | -- | 189 | 0.964 | 1.694 | 683 | -- | -- |
| 1976 | 0 | -- | 189 | 0.964 | 0.970 | 1570 | -- | -- |

